
As you are first getting started in the vast and confusing world of Search Engine Optimization, you’ll likely come across Google Analytics. Analytics is one of the most important and powerful tools for a web developer as the data tracking abilities allow your business or brand to make education decisions in the future. While SEO typically concerns itself with generating new traffic from search engines, your website marketing strategy is incomplete without understanding what users are doing on your actual site, regardless of acquisition method.
However, the depth and breadth of Google Analytics can be oftentimes overwhelming for the average user. There are so many different data points, so many opportunities to glean information, that it’s difficult to see the forest for the trees. And while practically every pieces of Analytics can bring value to your digital marketing or SEO strategy, there are a few key points that will reveal the most pertinent information for growth and sustained success.
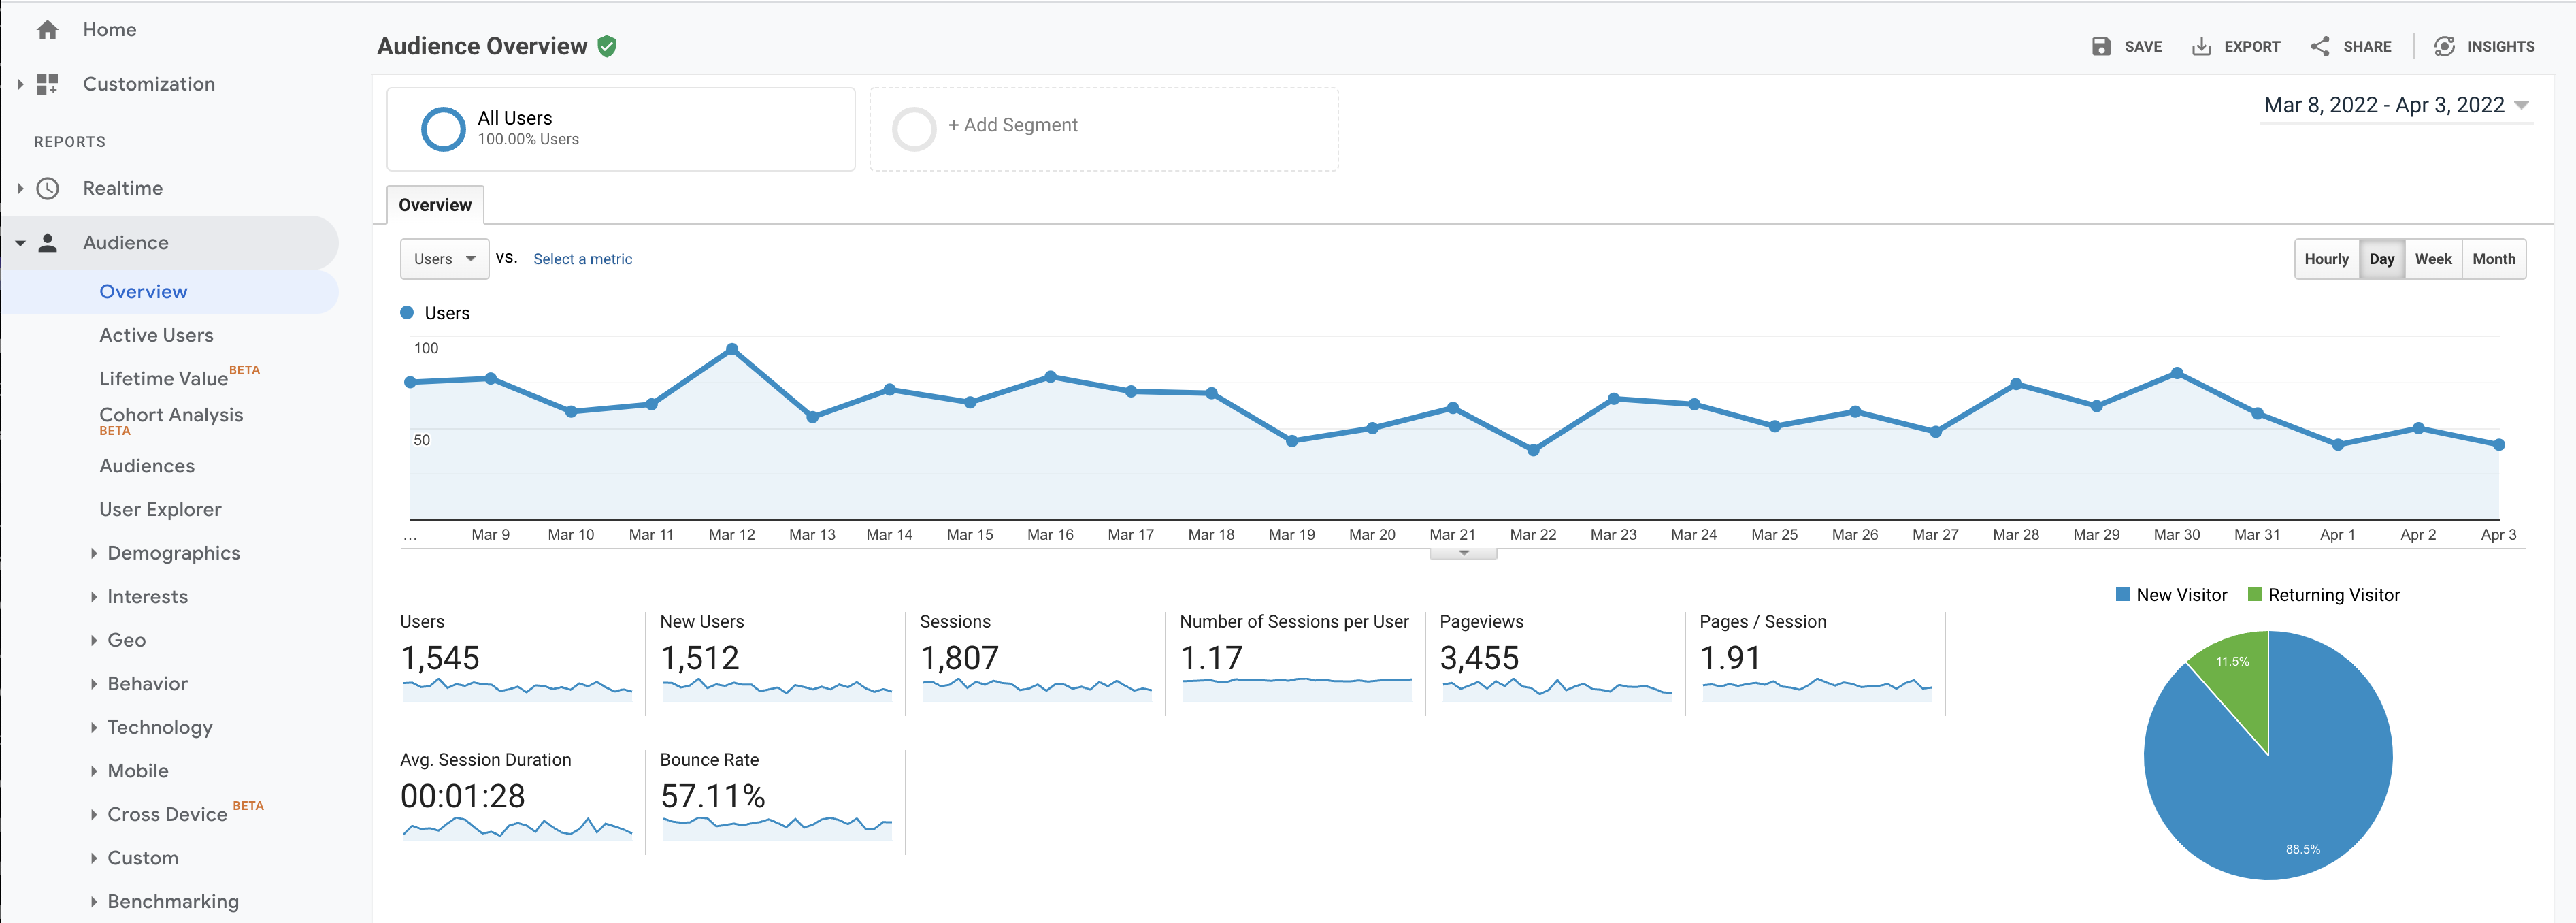
Audience Overview
On the lefthand sidebar of analytics, click on “Audience,” and it will default you into the Audience Overview section of Google Analytics. This screen will show you the most boilerplate and relevant information for overall site health including how many visits your website has received (sessions), how long the users stay on your website (session duration), and how many of the sessions you received immediately left without interacting with anything (bounce rate).
You can manipulate your date ranges in the top right of your screen to make sure you’re seeing a wide enough view, as well as compare month over month, and more. If you’re looking to see annual trends for particular seasons, it’s helpful to have a wide date range.
Things to Look For:
- You want sessions and users to be gradually climbing. For 99% of websites, you want more traffic, and more people generating said traffic.
- You want bounce rate to be steadily declining. If your bounce rate is already at 0 percent (or close to it), then you likely have accidentally installed your analytics code twice. If your bounce rate is over 50 percent, then you have too much poor quality traffic.
- You want session duration to be likely over 01:00, but not over 05:00. This one is different per business, but most brands want a longer session duration as long as it’s not impacting the efficiency of the website. E-commerce websites can easily have longer session durations, but lead-gen websites likely want traffic to move quicker.
There is much more to explore within the Audience Overview, but understanding these 3 main points will be a great start to understanding your digital marketing efforts for your website.
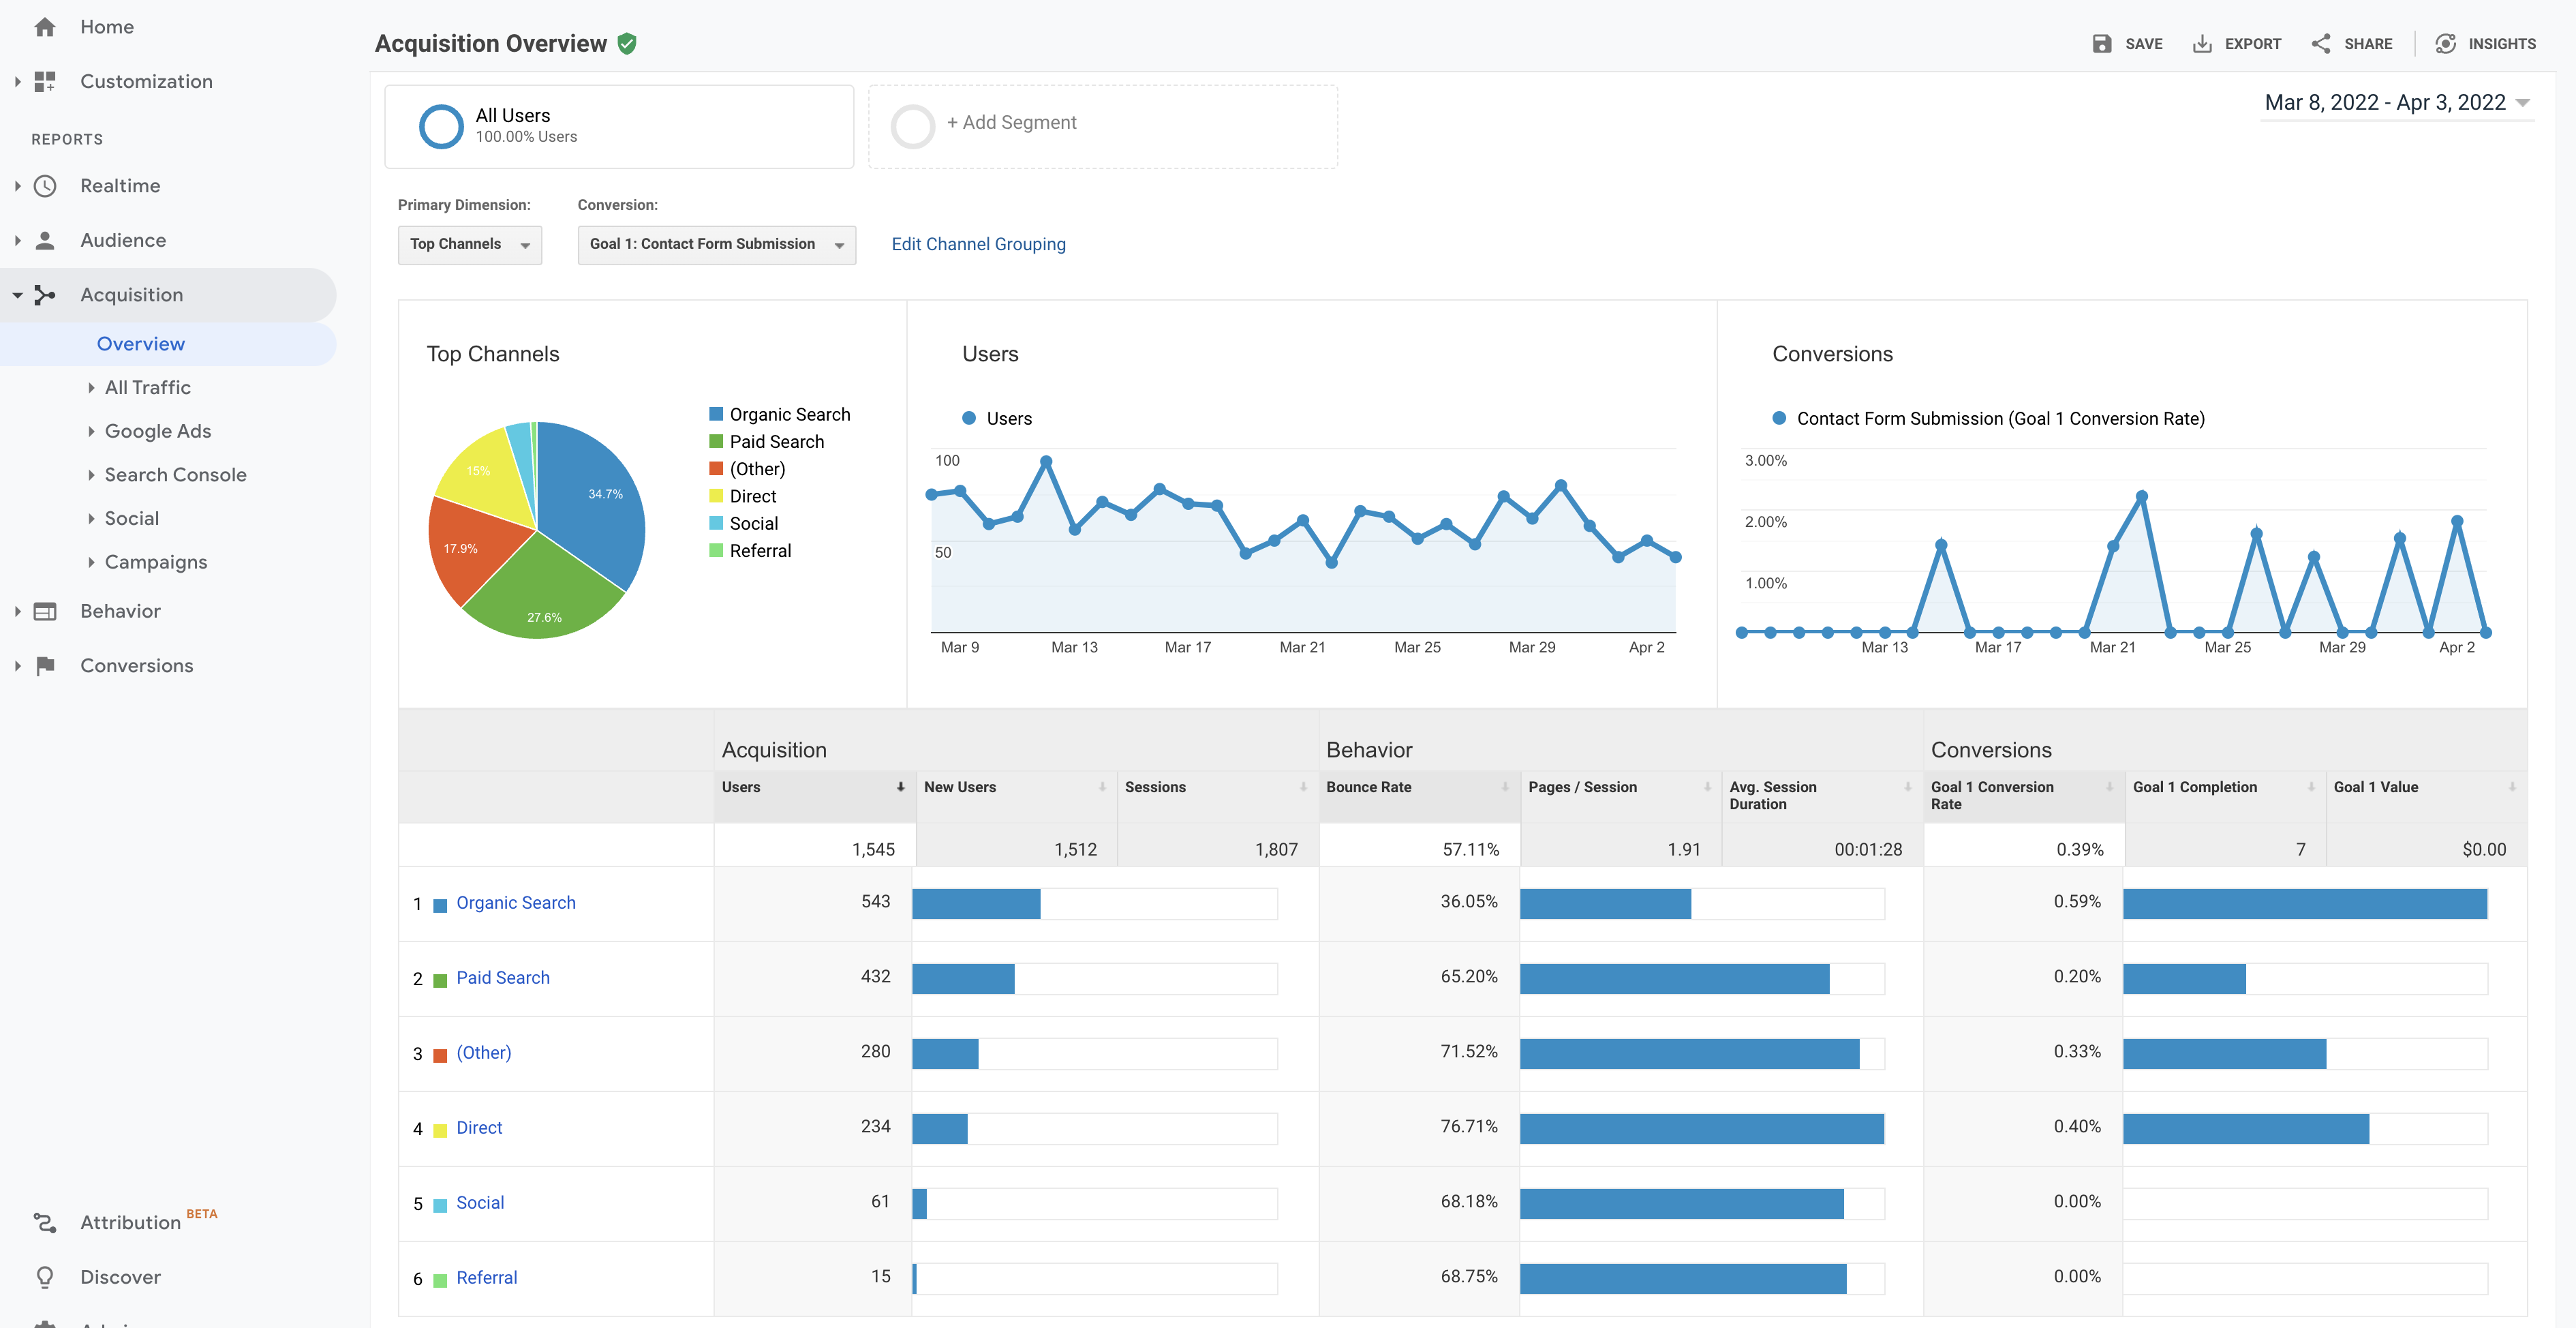
Acquisition Overview
On the lefthand sidebar of analytics, click on “Acquisition,” and it will default you into the Acquisition Overview section of Google Analytics, where you can view the different sources of traffic for how users got to the website. This screen will show you where a user was BEFORE they visited your website. While some of this data is perfect, you will be able to reliably see if a user found your website through a search engine, if they went directly there, or from some other source.
Things to Look For:
- You should be able to make a direct correlation between the traffic origin and the quality of the traffic. If 60% of your traffic came from organic search, you’ll want at least that much of your leads/sales/conversion to come from that same platform. If you don’t have any conversion data set up on the site, you’ll need to go to Admin>Goals and get those created.
- You want to have traffic coming in from a wide variety of sources. If you have too much coming from one source, then you’re likely missing opportunity elsewhere.
With the iOS changes in data reporting from 2021, there are pieces of the acquisition data that aren’t 100% accurate, specifically direct, social, and “other.” Any traffic coming from another app on an iPhone will likely be reporting as direct traffic, unless the user allows the Facebook app to share data with other apps.
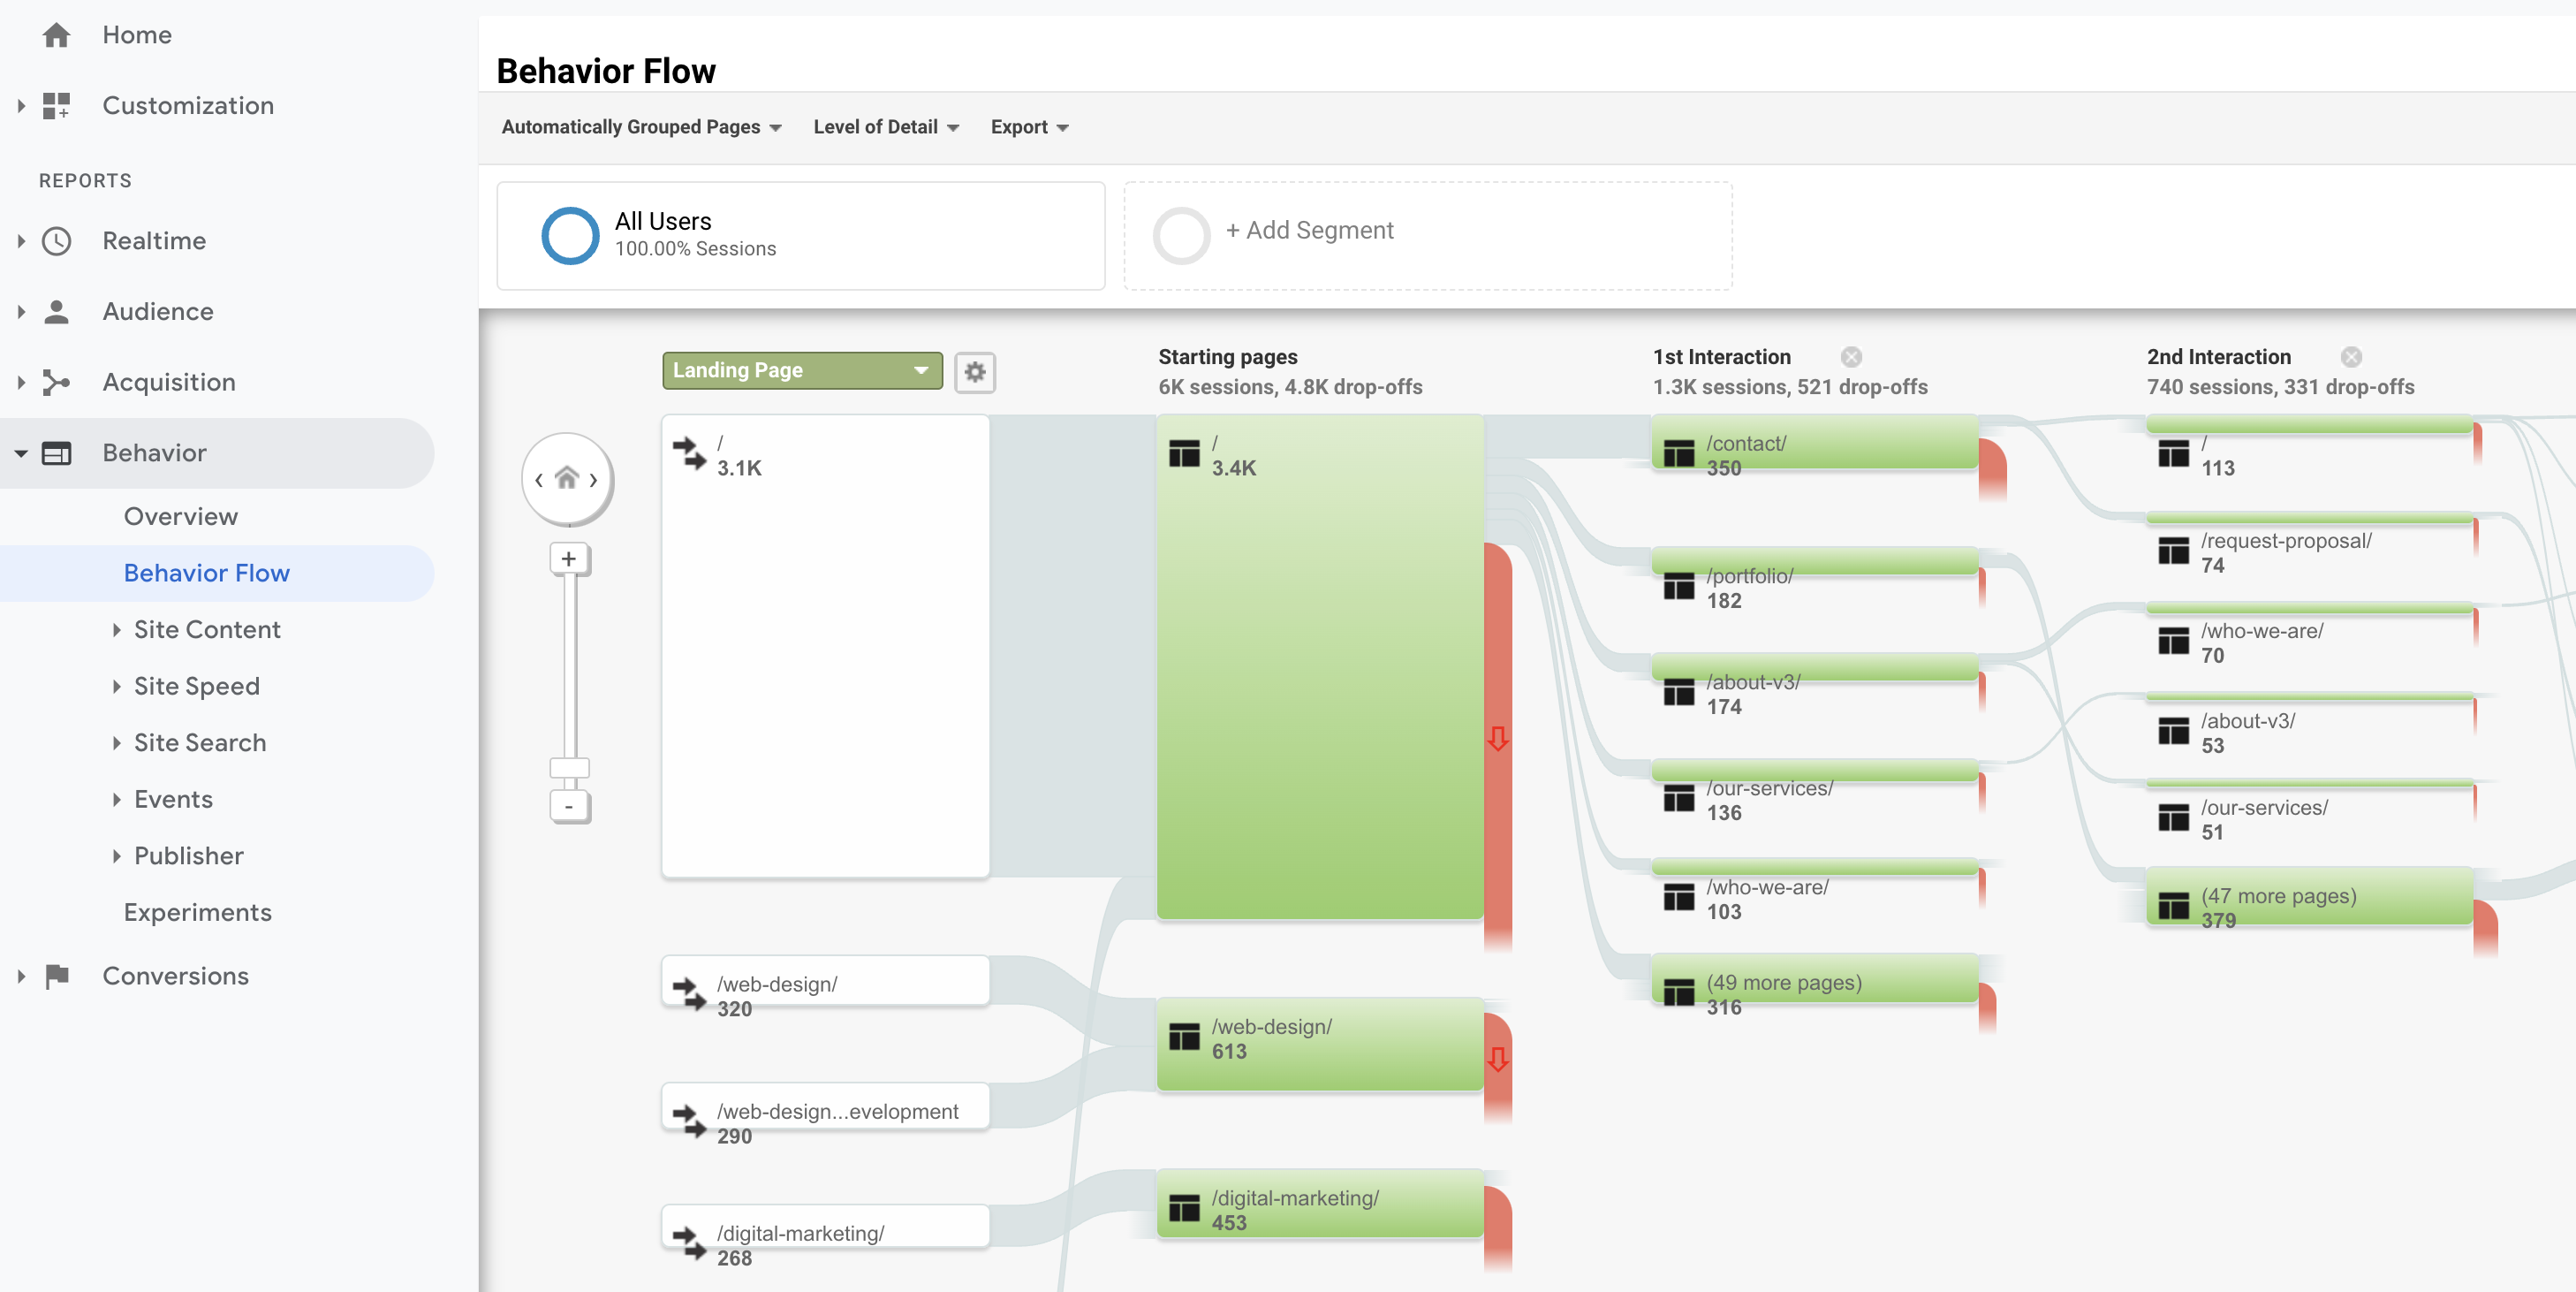
Behavioral Flow
One of the more intimidating pieces of data to read comes from the Behavioral Flow, on the left hand sidebar of Analytics, under Behavior. This graph shows us how a user flows through the website, from when users land on a landing page, to where they drop off. While you can add additional “clicks,” or “interactions,” to the graph, you’ll want most of your main actionable items to start showing up by the user’s 2nd or 3rd click in their flow.
Things to Look For:
- Your main call to action (add to cart, request a proposal, checkout, etc.) needs to start appearing by the 2nd or 3rd interaction on the website. If those actionable pages aren’t appearing high enough, then it’s likely a problem with your design.
- Your red “fall off” bars show how many of your users are leaving after viewing that particular page. If you have a page where over 75% of your users leave, there’s like a flow issue with that page. It could be loading incorrectly, not have clear direction, or any number of problems.
- Your main service/product/selling point should be the user’s 1st or 2nd interaction. Your goal should be to have the user flow from that main service to the CTA page.
Understanding your website’s analytics, SEO rank, and more can be difficult and time consuming, but it doesn’t have to be. Contact V3 Media Group and talk with us about anything digital marketing!